
Beyond the Snapshot: Temperature Mapping in Life Sciences
Discover how Continuous Temperature Mapping (cTM) combines IIoT sensors, real-time analytics, and AI/ML to identify environmental drift earlier and strengthen GxP monitoring, data visibility, and inspection readiness.
1.0. Introduction
A pharmaceutical cold room passed its temperature mapping study six months ago. The report was approved, the hot and cold spots were documented, and the facility returned to routine operations. Today, however, the HVAC system is behaving differently, door activity has increased, and a gradual temperature shift is developing in one corner of the room.
Nothing has crossed the established temperature limit. No alarm has fired. From the perspective of a conventional threshold-based monitoring system, everything appears normal.
But is the environment still behaving as it did when the mapping study was performed?
For professionals responsible for pharmaceutical quality, facilities engineering, and cold-chain operations, this question exposes an important operational gap. Temperature mapping establishes how conditions behave during a defined study period, while environmental conditions continue to evolve long after the report is signed.
The challenge is not simply proving that a storage environment was in control. It is maintaining visibility into whether it remains in control as conditions change.
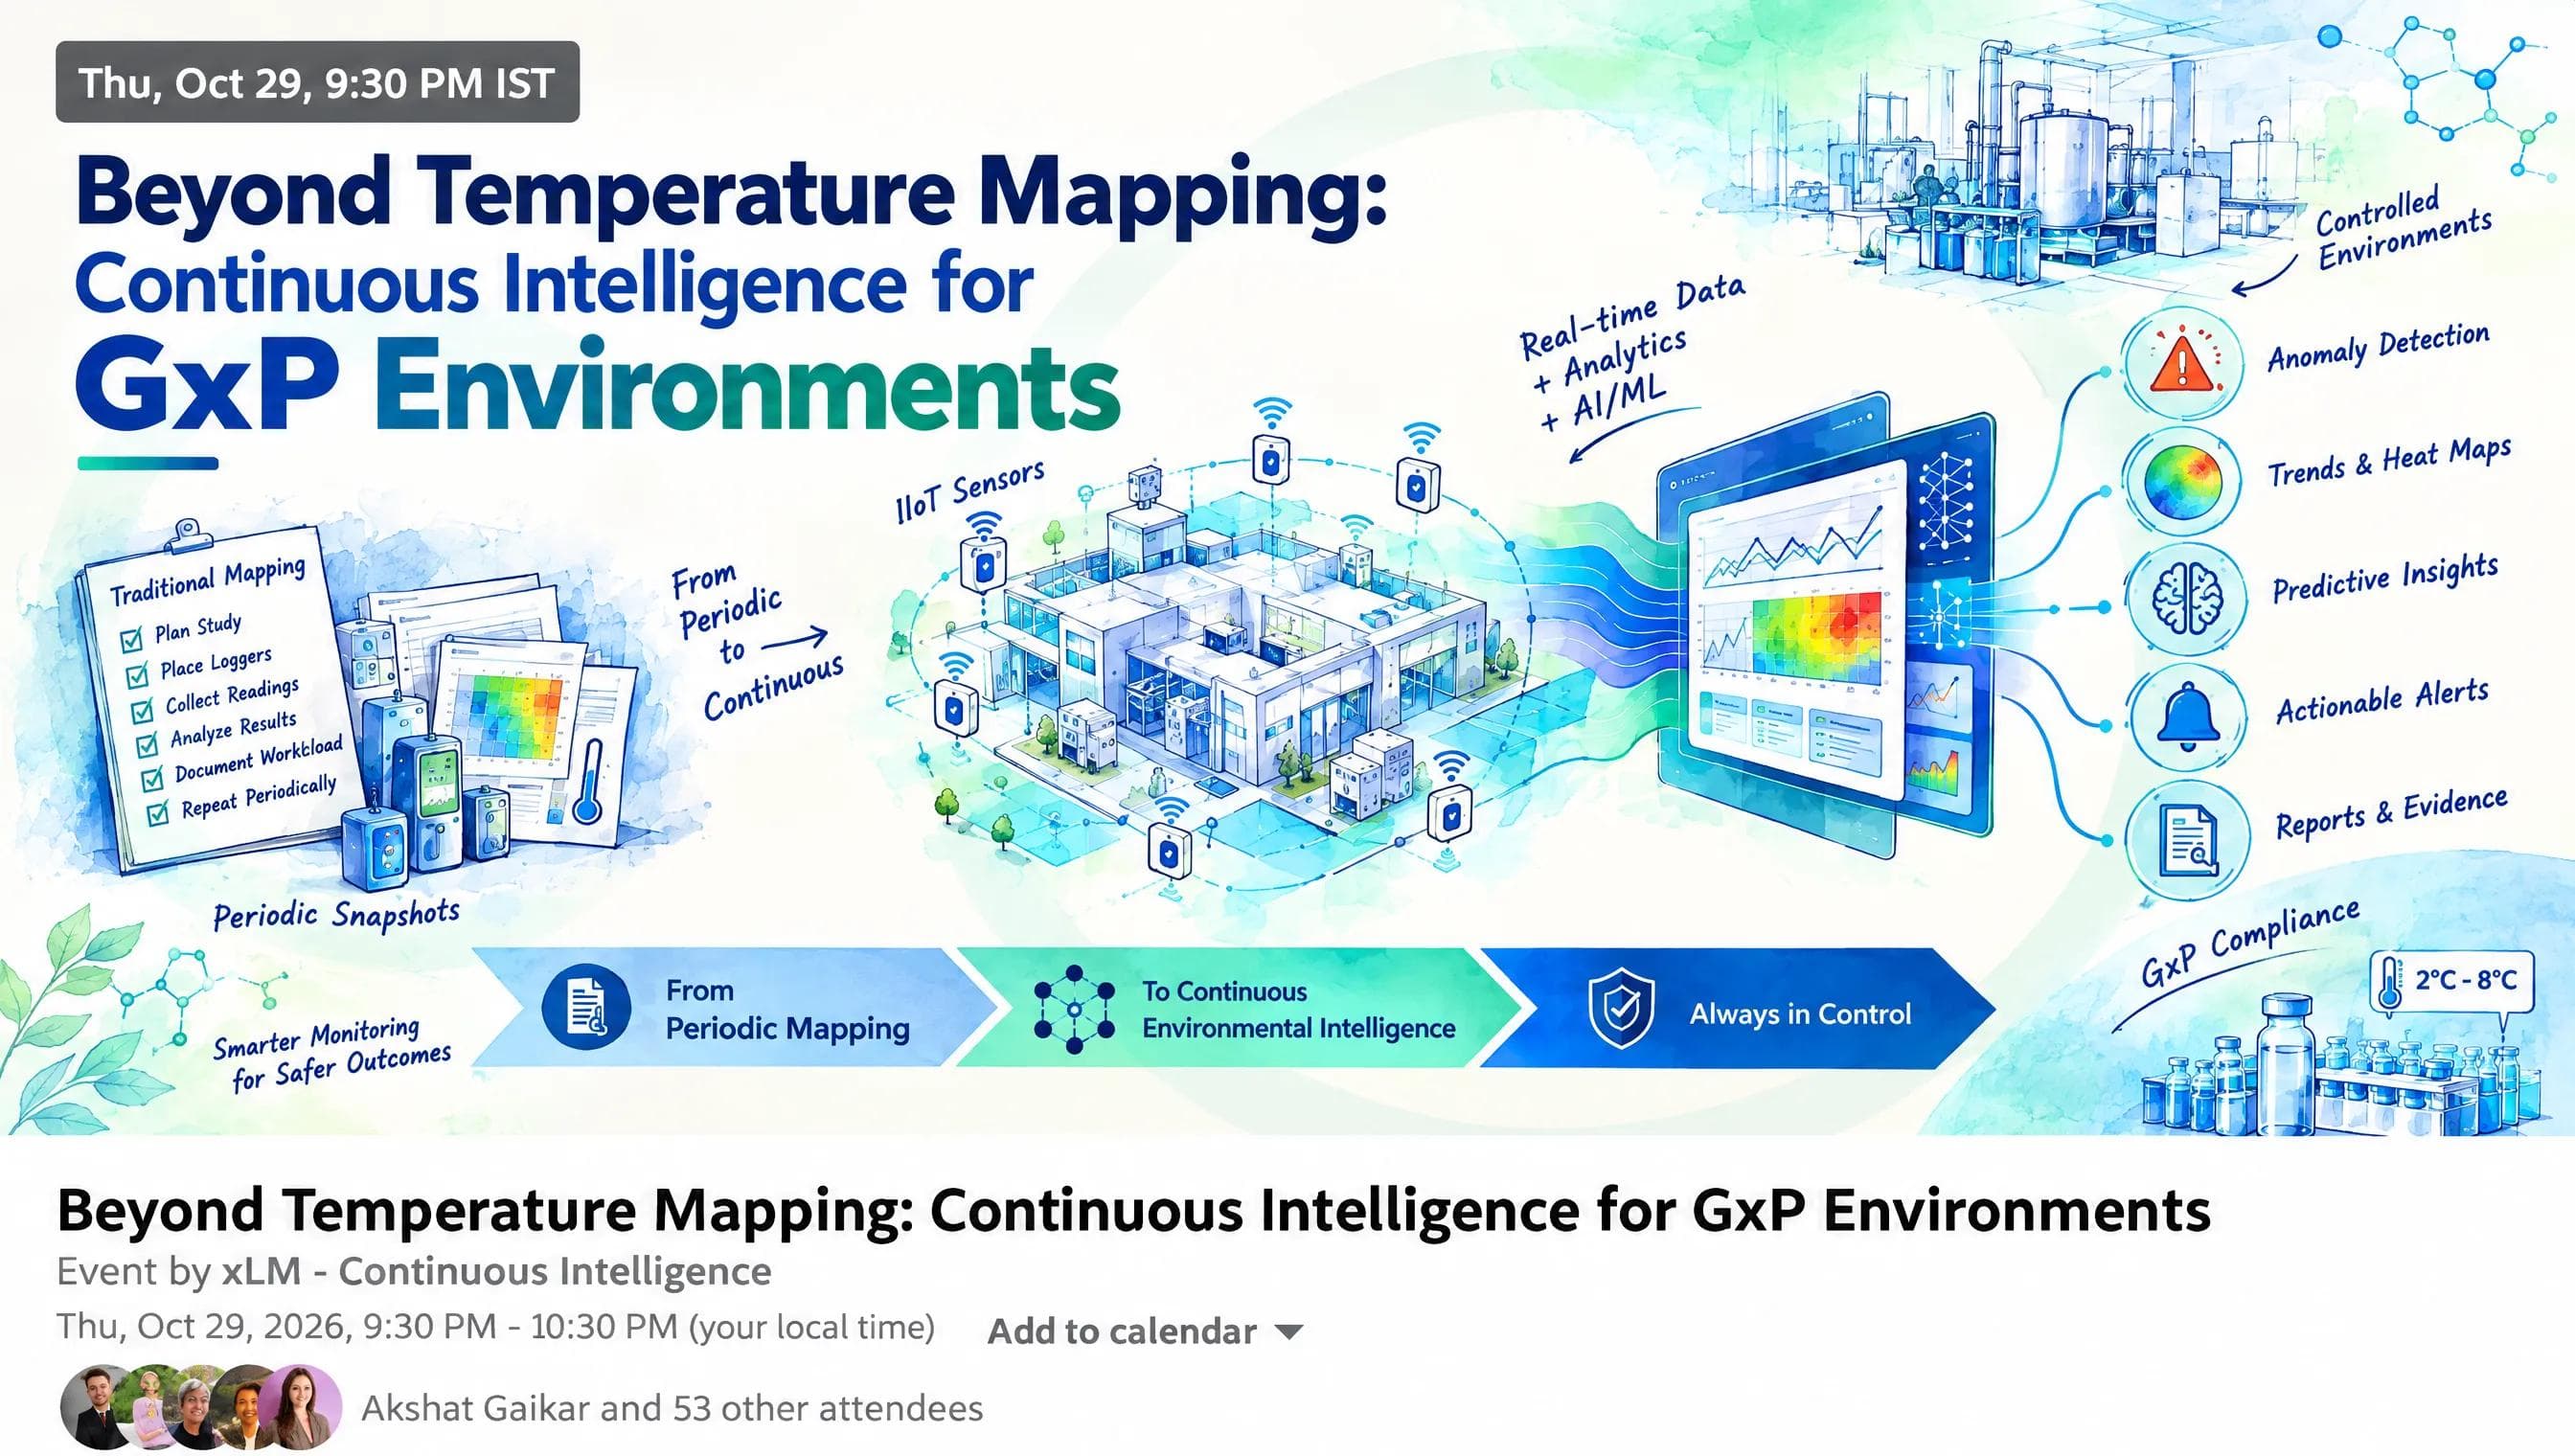
This is where Continuous Temperature Mapping (cTM) becomes relevant. By connecting continuous sensor data with analytics, visualization, and AI/ML capabilities, cTM extends the traditional mapping approach beyond periodic snapshots toward ongoing environmental intelligence.
2.0. The Gap Between Mapping Studies
Temperature mapping serves an essential purpose. It establishes temperature distribution across a controlled space, identifies hot and cold spots, and helps determine whether the environment can support the storage requirements of temperature-sensitive products.
However, a mapping study captures conditions under the operating circumstances observed during that exercise. HVAC performance, seasonal conditions, equipment loading, door-opening frequency, and storage patterns can all change afterward.
Consider a pharmaceutical warehouse that passes mapping during a period of relatively stable operations. Several months later, summer temperatures increase the cooling load, maintenance issues begin affecting airflow, and additional inventory changes air circulation. A location that previously maintained a stable temperature may gradually begin behaving differently.
Routine monitoring may record every reading, yet the significance of those readings can be difficult to recognize without examining trends across time and location. A temperature can remain within its permitted range while moving progressively away from its established operating pattern.
WHO guidance recognizes the importance of mapping storage areas and repeating studies when significant changes occur. PIC/S guidance also emphasizes risk-based repetition following significant changes. Periodic re-verification schedules vary with the applicable guidance, facility procedures, and risk assessment, annual or biennial intervals may be used in practice, but they should not be treated as a universal WHO or PIC/S requirement.
A successful mapping study provides evidence about conditions during a defined period. Maintaining confidence in those conditions over time is a different challenge.
The question, then, is what happens between studies. Can teams identify a developing change before it becomes a temperature excursion, or must they wait until an alarm, investigation, or scheduled reassessment brings it to attention?
3.0. The Cold Room That Drifted
Imagine a biotechnology facility operating a cold room maintained between 2°C and 8°C for temperature-sensitive biologics. During the original mapping study, the team identifies a cold spot near the evaporator and a warm spot close to the door. Both remain within the required limits, and the study passes.
The facility documents the findings, establishes routine monitoring, and continues operations. For several months, the room performs as expected.
Then a change to the refrigeration system's defrost-cycle timing alters the pattern of cooling and airflow. Overnight, the previously stable cold spot begins warming by approximately 1–2°C relative to its earlier behavior. The temperature remains within the permitted range, so the conventional threshold alarm does not activate.
At first glance, there may be little reason for concern. But the repeated overnight pattern suggests that the room is no longer behaving as it did during the original study.
Defrost cycles can produce temporary temperature fluctuations, with their magnitude depending on the equipment, control strategy, sensor location, and operating conditions. An alert system that does not account for expected defrost behavior may generate nuisance alarms. Conversely, poorly designed filtering or overly broad alert thresholds can make meaningful changes harder to distinguish from normal fluctuations.
The facility now faces two questions, Is this a predictable operational variation, or is it an early indication of deteriorating temperature control? And what evidence can help the team make that distinction?
Continuous monitoring combined with trend analysis could reveal the recurring overnight warming pattern weeks before a formal excursion occurs. Correlating the trend with the defrost-cycle change would give facilities engineering and Quality a stronger starting point for investigation.
The trend was real, and it was moving toward an excursion. No threshold had been breached, but the environment was no longer behaving as it did during the original mapping study.
This is a hypothetical scenario, but the operational challenge is familiar, a system can remain inside its limits while its behavior changes in ways that deserve attention.
4.0. From Temperature Readings to Environmental Intelligence
The cold room scenario illustrates the difference between collecting readings and understanding environmental behavior.
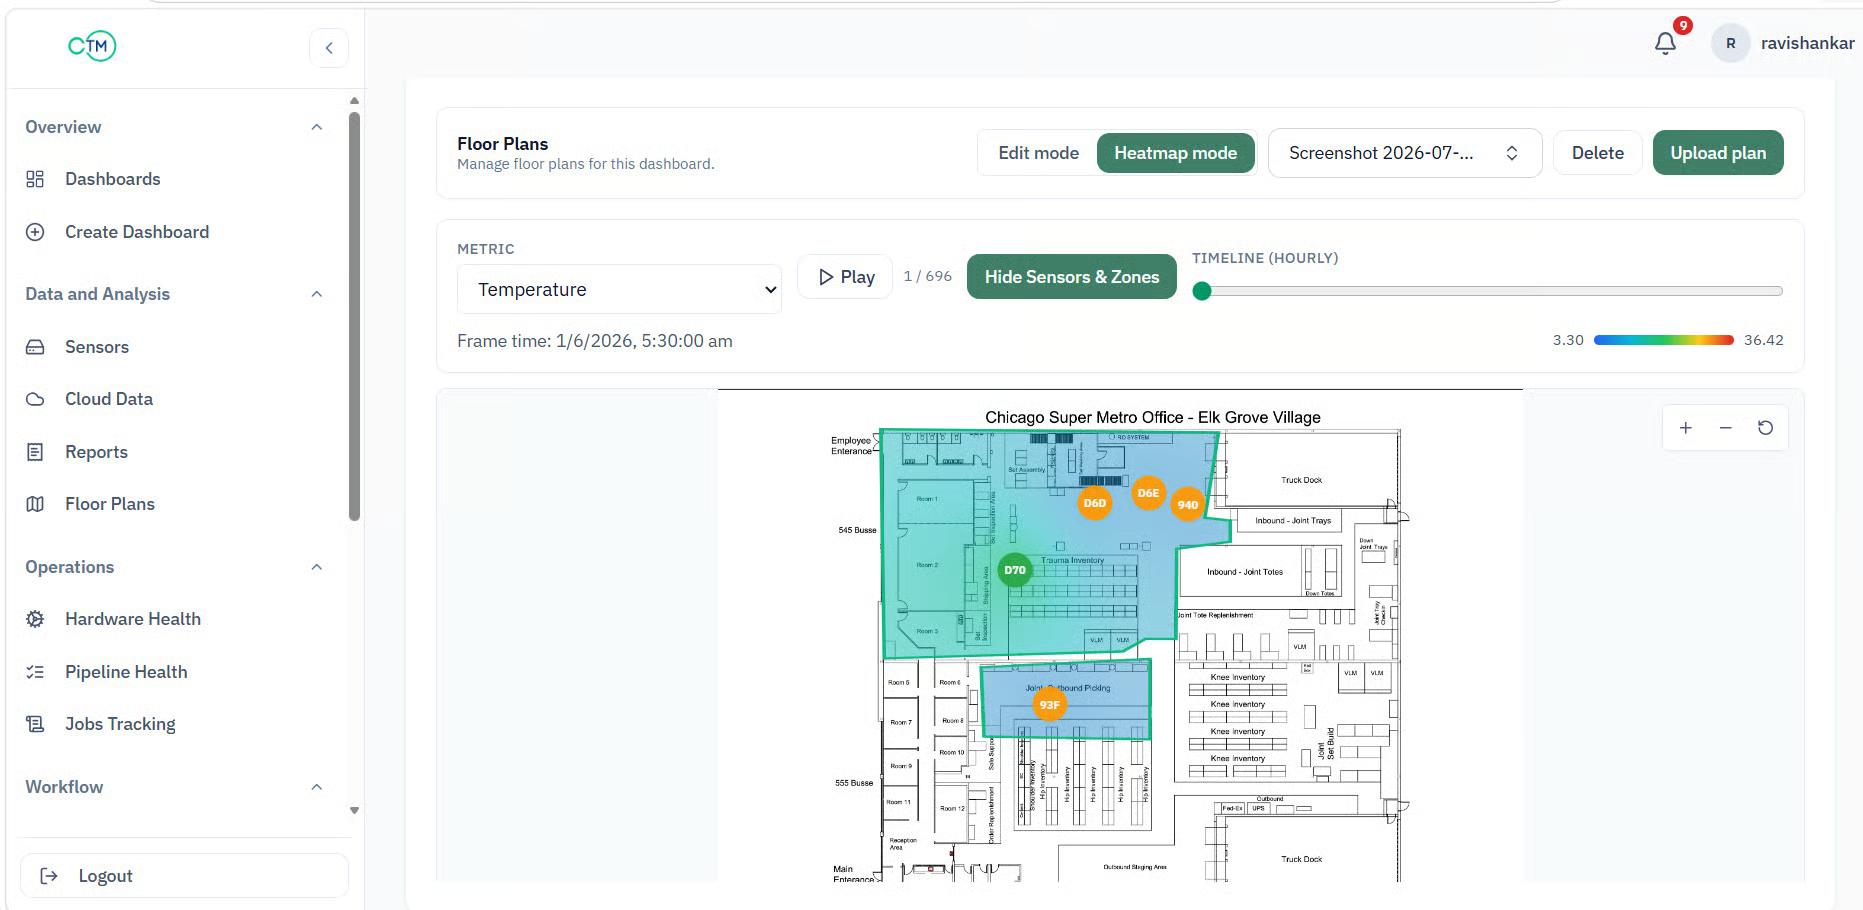
IIoT sensors can provide a continuous stream of temperature measurements across relevant locations. Real-time analytics and visualization can organize those measurements into trends, spatial heat maps, and comparisons that help teams understand how conditions evolve.
In the cold room example, continuous data would have shown the overnight warming pattern weeks before it became a potential excursion. Instead of discovering the change during the next mapping exercise, the team could have investigated it while the temperature remained within its established range.
AI/ML can extend this capability by helping identify unusual patterns, recurring fluctuations, and potential drift that may be difficult to detect through manual review alone. Its usefulness depends on data quality, appropriate model design, and a clear understanding of what the system is intended to detect.
There is an important distinction here. Detecting an excursion means recognizing that a reading has crossed a defined limit. Understanding environmental behavior means recognizing patterns that may indicate a developing problem, even before a limit is crossed.
Continuous monitoring using suitable, calibrated devices is already an important expectation in pharmaceutical storage and distribution. cTM builds on that foundation by connecting ongoing measurements with analytics, visualization, and more systematic interpretation.
The value is not simply having more data. It is making environmental data easier to interpret and act upon.
The objective is not to make every fluctuation an alert. It is to help teams distinguish expected behavior from meaningful change and direct attention where it can make a difference.
5.0. What Continuous Temperature Mapping (cTM) Changes
The first shift is visibility. Rather than relying primarily on a report generated during a mapping study, teams can examine how temperatures behave across locations and over time. In the cold room scenario, this means seeing the recurring overnight warming pattern rather than encountering isolated readings without their broader context.
This leads to earlier awareness. Trend analysis can flag unusual changes for review before they become excursions. The purpose is not to predict every failure or eliminate every risk, but to provide an opportunity to investigate emerging patterns while there is still time to understand and address their causes.
There is also a practical benefit: reduced manual effort. Automated data collection, visualization, and report generation can reduce repetitive work involved in consolidating readings and preparing temperature-mapping outputs. Depending on the facility and its qualification strategy, better visibility may also help organizations optimize mapping activities and associated costs without compromising required studies or documented controls.
Finally, context matters. In the cold room example, the temperature trend alone identifies a change; connecting that trend with the defrost-cycle adjustment helps explain why it may be occurring. Combining environmental data with operational knowledge gives engineering and Quality teams a more useful basis for investigation.
These benefits depend on the quality of the monitoring system and the processes surrounding it. Continuous data does not automatically establish compliance, that a room is qualified, that sensors are appropriately positioned, or that an excursion has been adequately investigated.
Continuous monitoring should not be interpreted as automatic proof of compliance. Sensor suitability, calibration, data integrity, and documented review remain essential.
cTM is most valuable when it complements established qualification and mapping practices with a clearer, more continuous understanding of environmental performance.
6.0. Connecting Continuous Monitoring with GxP Assurance
In a GxP environment, collecting temperature data is only part of the responsibility. Organizations must demonstrate that monitoring equipment is suitable for its intended purpose, measurements are reliable, records are appropriately controlled, and out-of-limit or out-of-trend results receive documented review and appropriate action.
The cold room scenario shows why these responsibilities matter. An analytical model might flag the overnight warming trend and associate it with a change in operating behavior. A qualified reviewer must still determine its significance, assess potential product impact where appropriate, and initiate the investigation required by established procedures.
AI/ML outputs should support this process, not replace Quality judgment. Teams need to understand what the model is designed to detect, how its outputs are evaluated, and how recommendations translate into documented decisions.
The final piece is maintaining evidence that connects the observation, investigation, and response. Without that connection, an alert is simply another notification. With appropriate controls and documented review, it can become a useful input into environmental and quality oversight.
Monitoring more frequently increases data availability. Maintaining stronger evidence of environmental control depends on reliable measurements, appropriate controls, meaningful interpretation, and documented actions.
Continuous environmental intelligence therefore brings together engineering visibility and quality accountability rather than treating them as separate activities.
7.0. See Continuous Temperature Mapping in Practice
These concepts become clearer when viewed in an actual working application—which is exactly what we will demonstrate in our upcoming xLM Continuous Intelligence LinkedIn Live.
The cold room scenario illustrates the operational question behind the session: how can teams move from individual sensor readings toward a clearer understanding of temperature behavior, emerging anomalies, and environmental conditions over time?
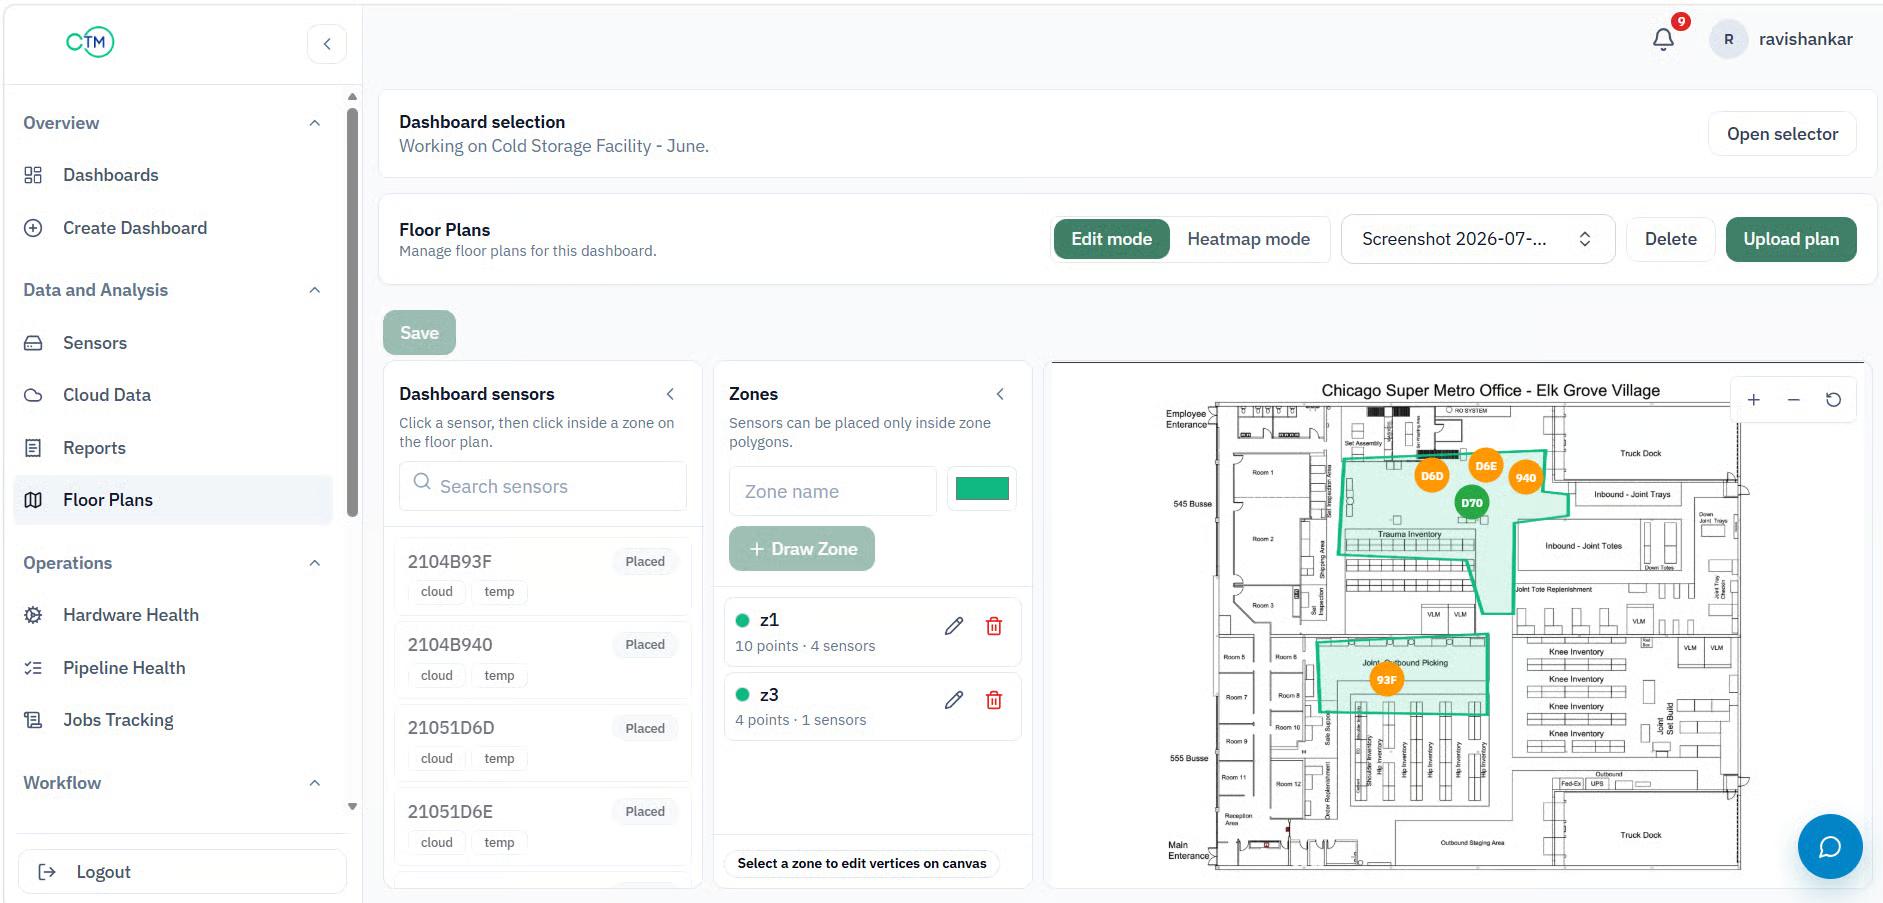
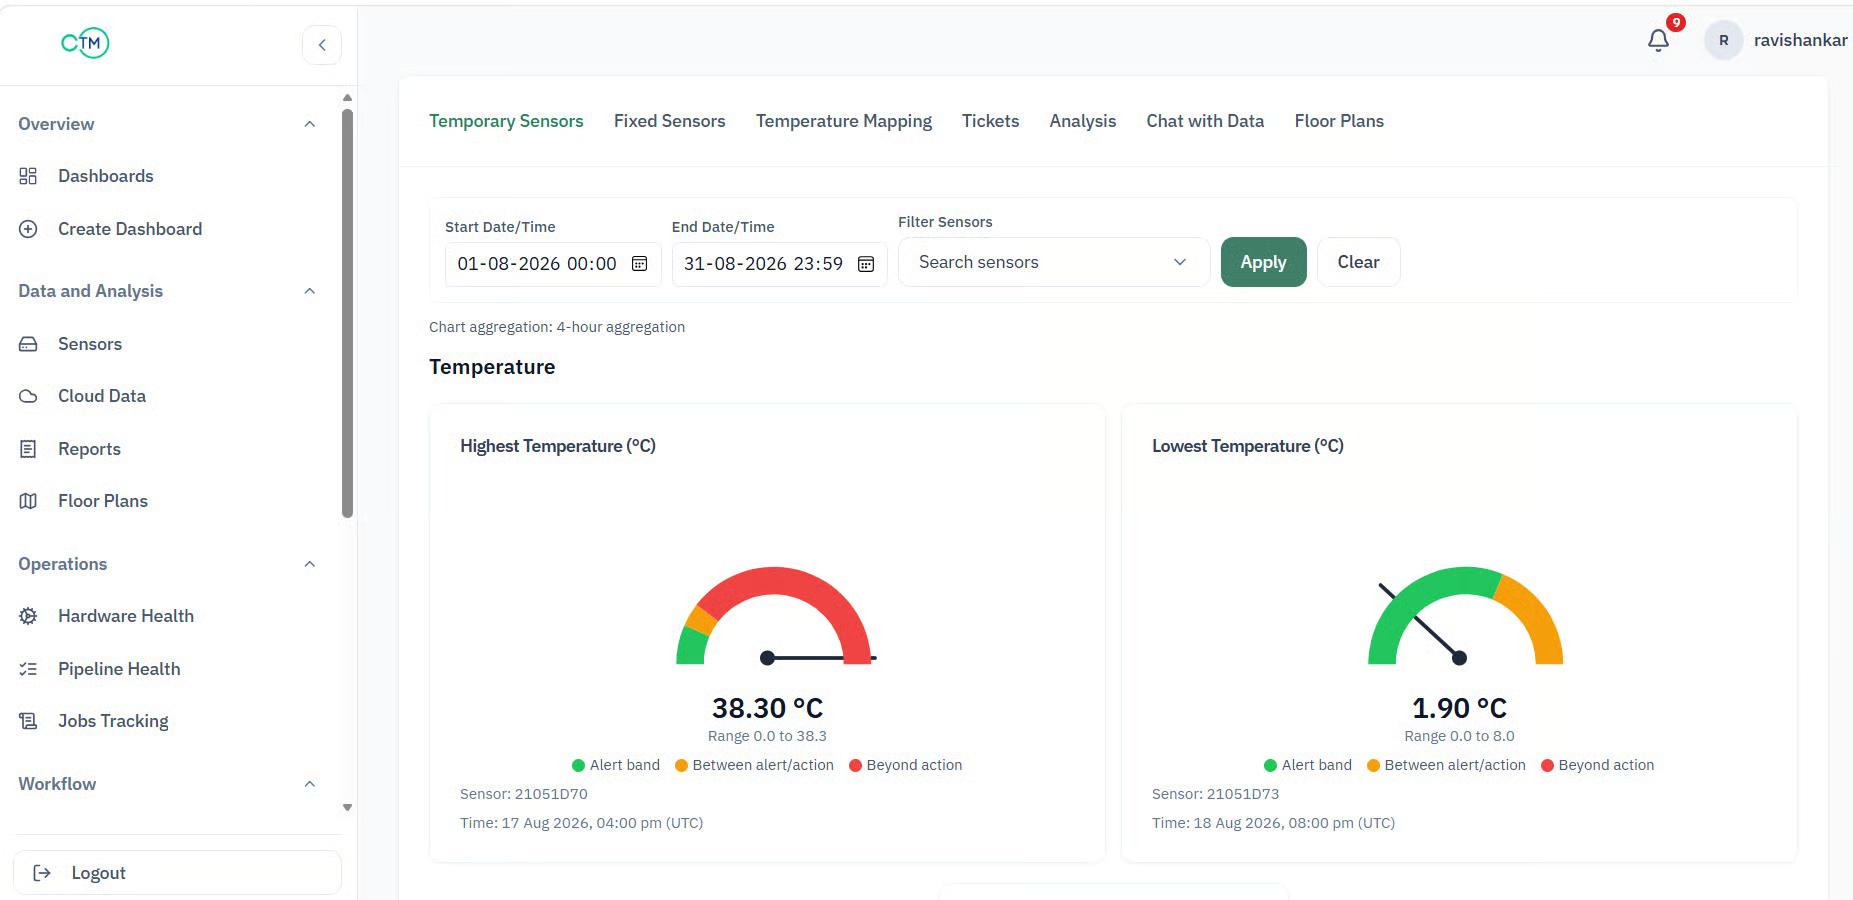
During the session, we will showcase the working Continuous Temperature Mapping (cTM) application, demonstrating how temperature data moves from connected sensors and continuous monitoring into analytics, anomaly insights, visualizations, and temperature-mapping reports.
The discussion will explore how IIoT sensors, real-time data, and AI/ML can extend visibility beyond periodic mapping studies, help identify potential temperature risks earlier, and reduce manual effort associated with traditional mapping approaches. We will also consider what these capabilities mean for GxP monitoring, data integrity, validation, and inspection readiness.
This is where the concept becomes tangible, temperature data moving from connected sensors into analytics, anomaly insights, visualizations, and temperature-mapping reports.
For professionals working in pharmaceutical quality, facilities engineering, cold-chain operations, and environmental monitoring, the session offers an opportunity to examine the practical relationship between continuous data, meaningful analytics, and operational decision-making.
📅LinkedIn Live Event
October 29, 2026 | 12:00 PM EST
Beyond Temperature Mapping: Continuous Intelligence for GxP Environments
Featuring
Nagesh Nama – CEO, xLM Continuous Intelligence
&
Vaishnavi Kamath – AI/ML Engineer, xLM Continuous Intelligence
👉 Register for the LinkedIn Live conversation to see continuous temperature mapping in practice and explore how organizations can move from confirming whether an environment passed its last study to understanding whether it remains in control.
8.0. Recent LinkedIn Live Events by xLM ContinuousTV
About the Authors

About Nagesh Nama
Nagesh Nama is the Founder and CEO of xLM Continuous Intelligence and ValiMation, bringing nearly 30 years of experience in AI-driven GxP compliance, computer system validation, and regulatory technology for the life sciences industry. A recognized thought leader, he pioneered the industry's first Continuous Validation platform supporting compliant IaaS, PaaS, and SaaS environments under 21 CFR Part 11 and Annex 11. His work focuses on advancing intelligent validation, AI-powered compliance, predictive maintenance, temperature mapping, and GxP AI agents to help pharmaceutical, biotechnology, and medical device organizations accelerate digital transformation while maintaining continuous compliance. Nagesh is a member of the Forbes Technology Council and the Fast Company Executive Board, a contributor to Forbes and Fast Company, and has been featured by Microsoft for his work in AI agents.