cTM: Intelligent GxP Environmental Monitoring for Pharma
Discover how cTM transforms GxP environmental monitoring for life sciences. Join xLM’s LinkedIn Live event for real-time AI insights & continuous compliance.
1.0. Introduction
On December 11, 2025, 2:00 PM EST, xLM will host a LinkedIn Live session demonstrating how Continuous Temperature Mapping (cTM) is transforming environmental monitoring in pharmaceutical manufacturing, biotech operations, warehousing, and cold-chain environments.
This newsletter builds upon our earlier article with deeper insights, real-world scenarios, and practical examples of how cTM elevates continuous environmental monitoring in regulated industries.
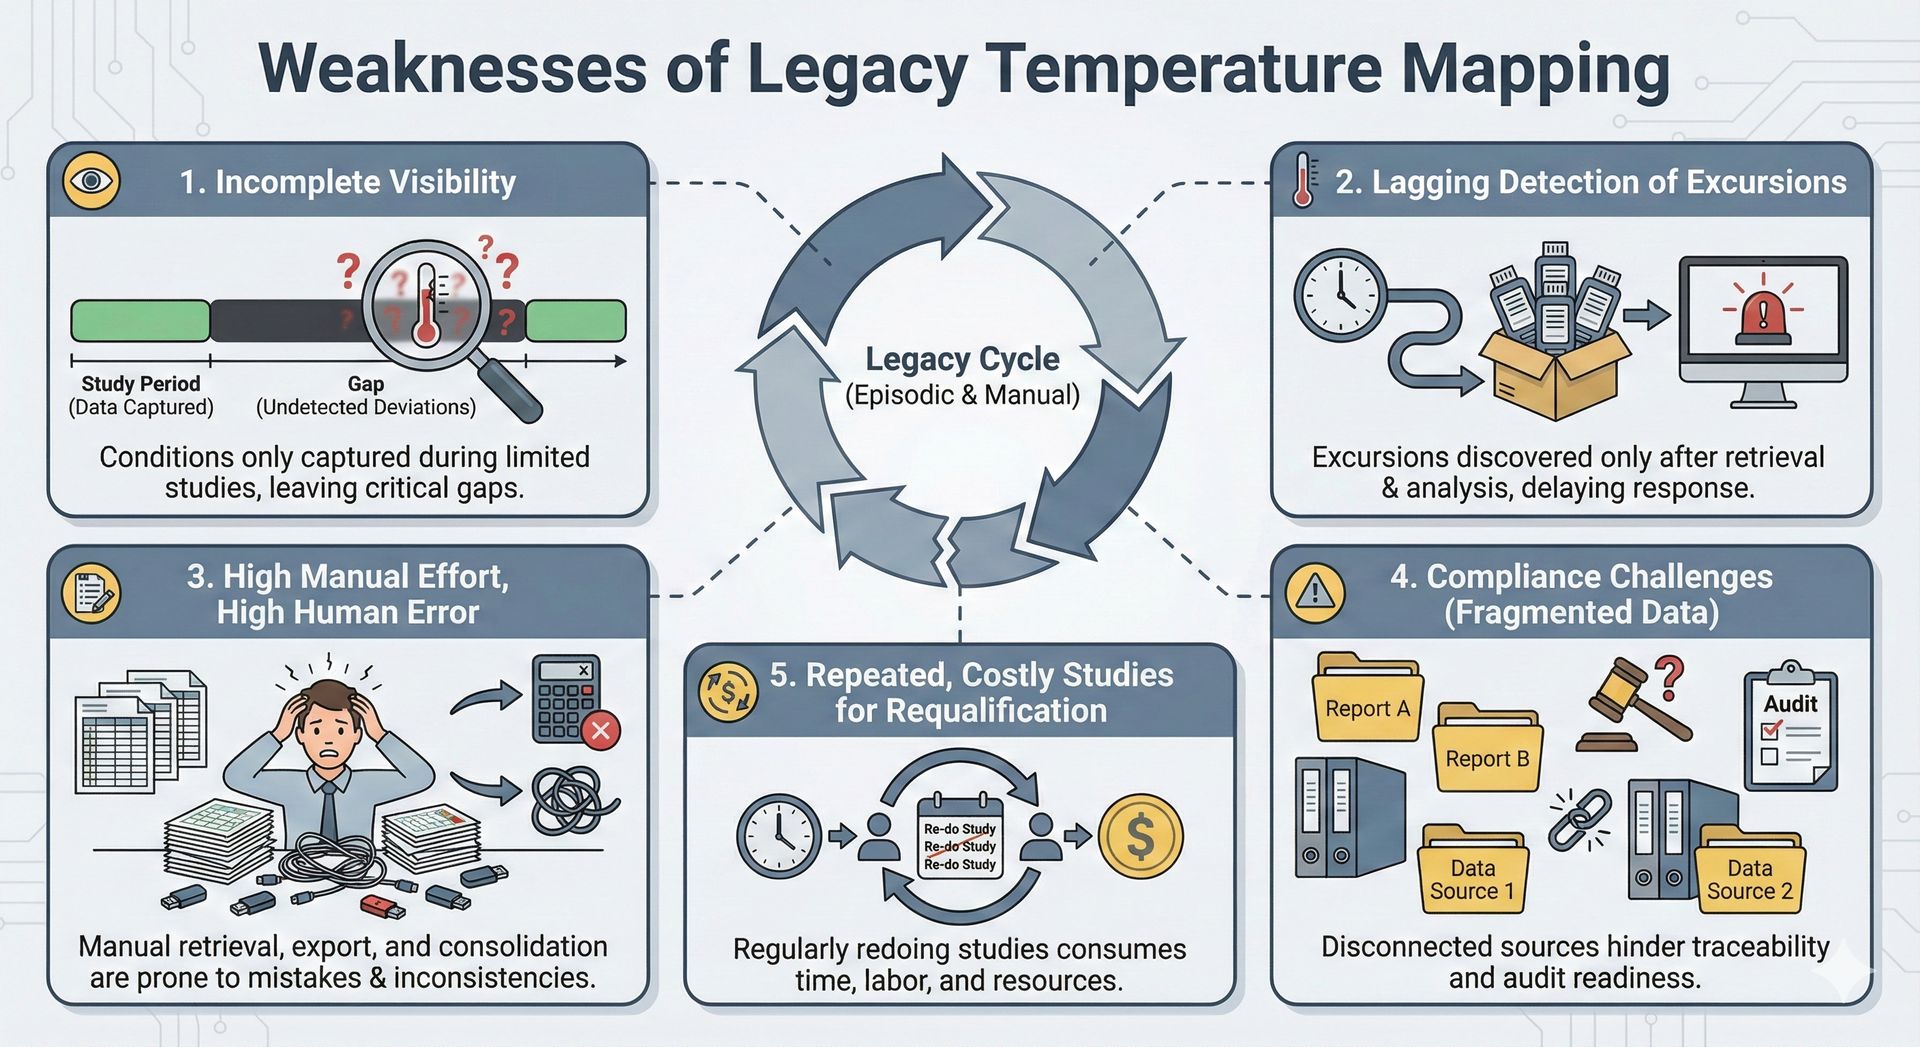
2.0. Why Legacy Temperature Mapping Can’t Keep up Anymore
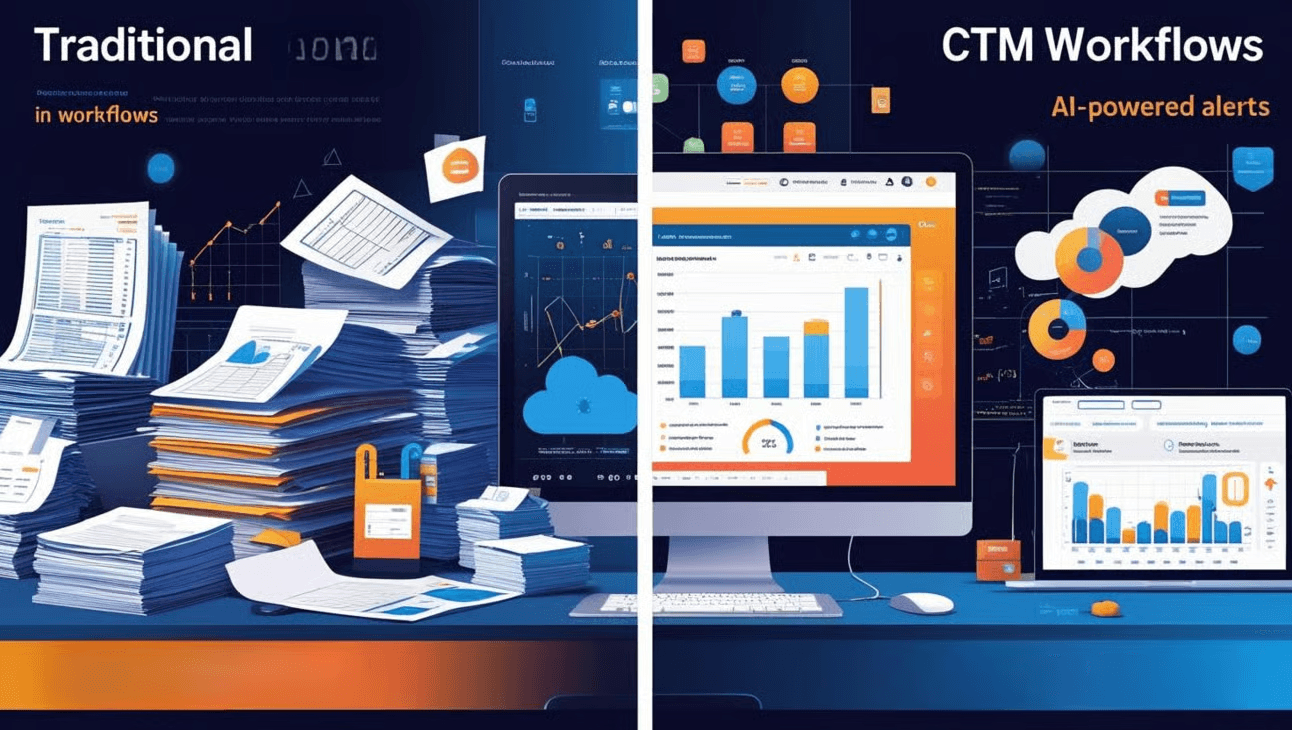
Traditional temperature mapping studies are episodic, you deploy data loggers for a validation cycle, retrieve them days later, export data manually, analyze spreadsheets, and generate static reports. This results in:
- Incomplete visibility (data only during studies): Environmental conditions are captured only during limited study periods, leaving gaps where critical deviations may go undetected.
- Lagging detection of excursions: Temperature or humidity excursions are discovered only after data retrieval, delaying response and risking product integrity.
- High manual effort, high human error: Teams spend hours retrieving loggers, exporting files, and consolidating spreadsheets, a manual workflow prone to mistakes and inconsistencies.
- Compliance challenges due to fragmented data: Disconnected data sources and static reports hinder traceability, audit readiness, and data integrity.
- Repeated, costly studies for requalification: Facilities regularly redo mapping studies to maintain compliance, consuming time, labor, and resources.
Modern GxP operations require continuous assurance, traceability, and audit readiness that old processes cannot provide.
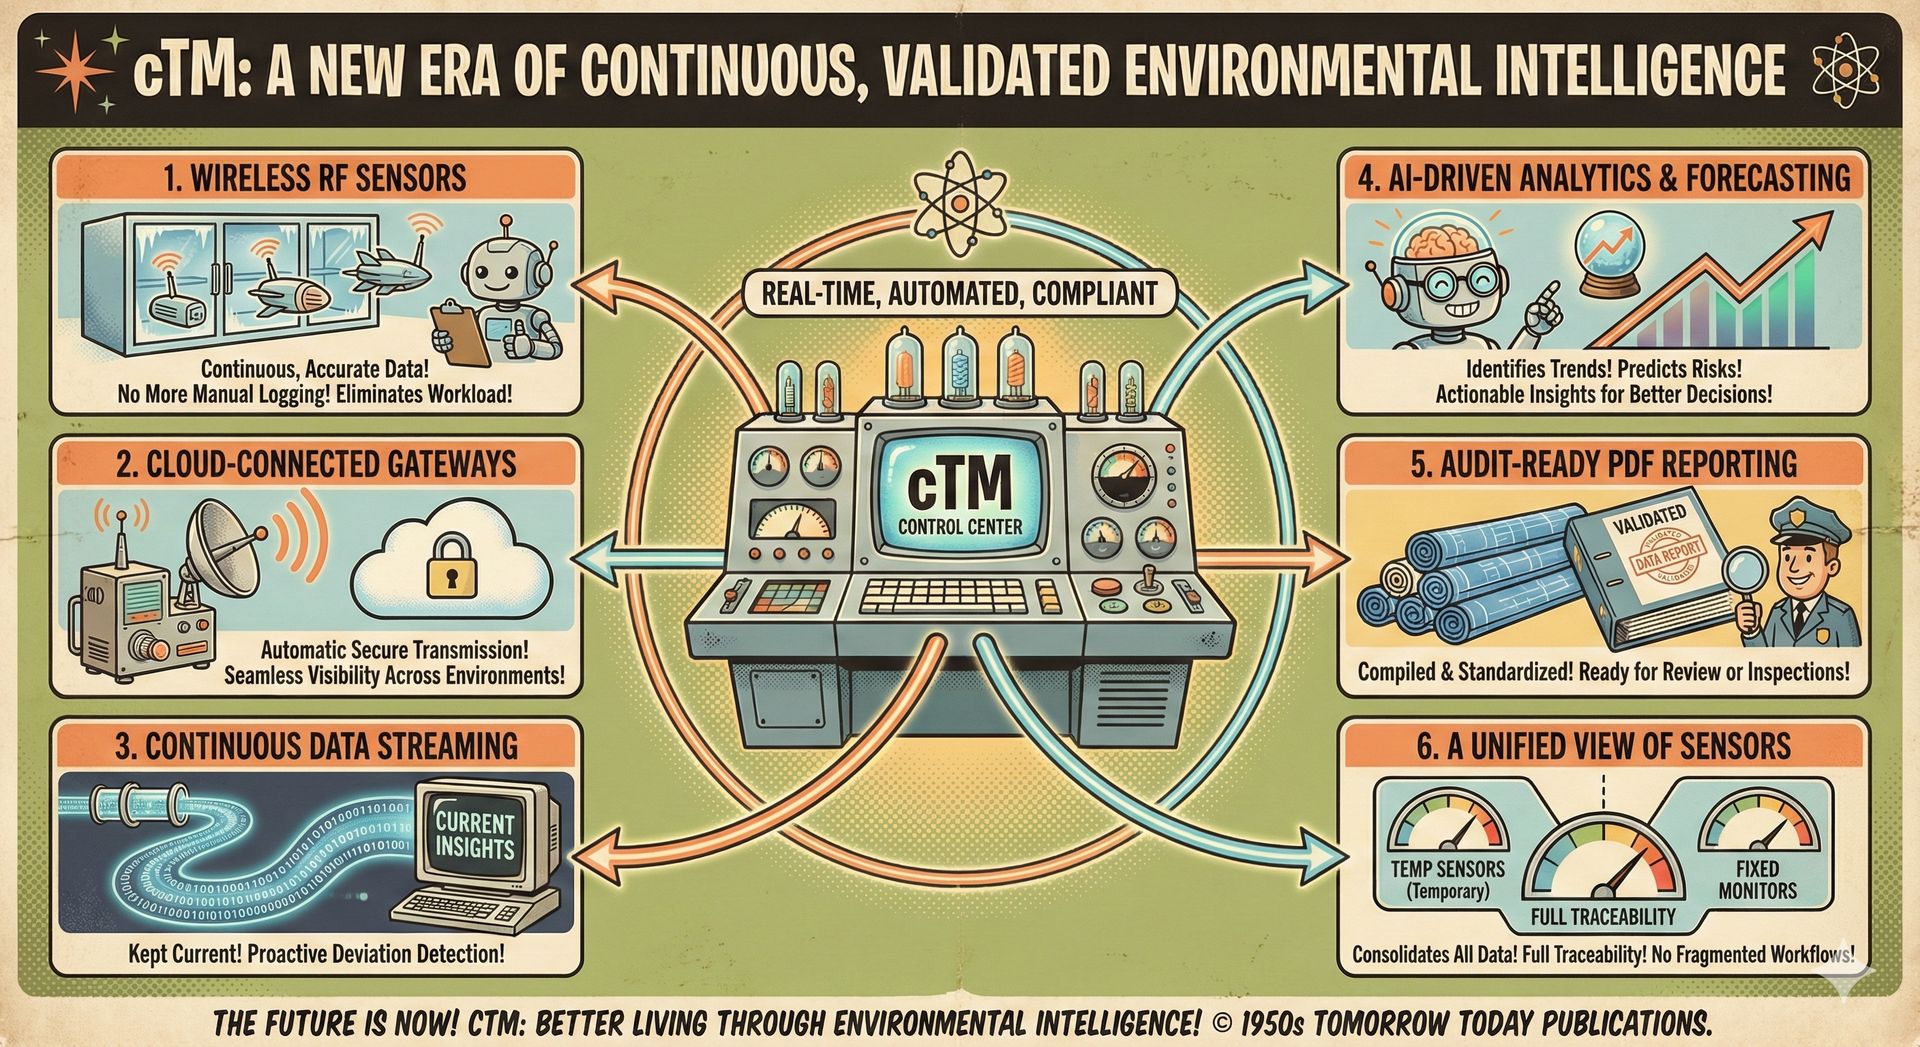
3.0. cTM: A New Era of Continuous, Validated Environmental Intelligence
xLM’s Continuous Temperature Mapping (cTM) transforms traditional mapping into a real-time, validated, AI-powered environmental monitoring platform by integrating:
- Wireless RF sensors: These sensors capture temperature data continuously with high accuracy, eliminating manual logger handling and reducing validation workload.
- Cloud-connected gateways: Gateways collect sensor data automatically and securely transmit it to the platform, ensuring seamless, real-time visibility across environments.
- Continuous data streaming: Streaming keeps temperature insights current, enabling proactive deviation detection instead of waiting for post-study analysis.
- AI-driven analytics & forecasting: AI identifies trends, predicts risks, and provides actionable insights to improve compliance and operational decisions.
- Audit-ready PDF reporting: Reports compile validated data, annotations, and compliance narratives into standardized formats ready for review or inspections.
- A unified view of temporary + fixed sensors: This view consolidates all mapping and monitoring data into one dashboard, ensuring full traceability and eliminating fragmented workflows.
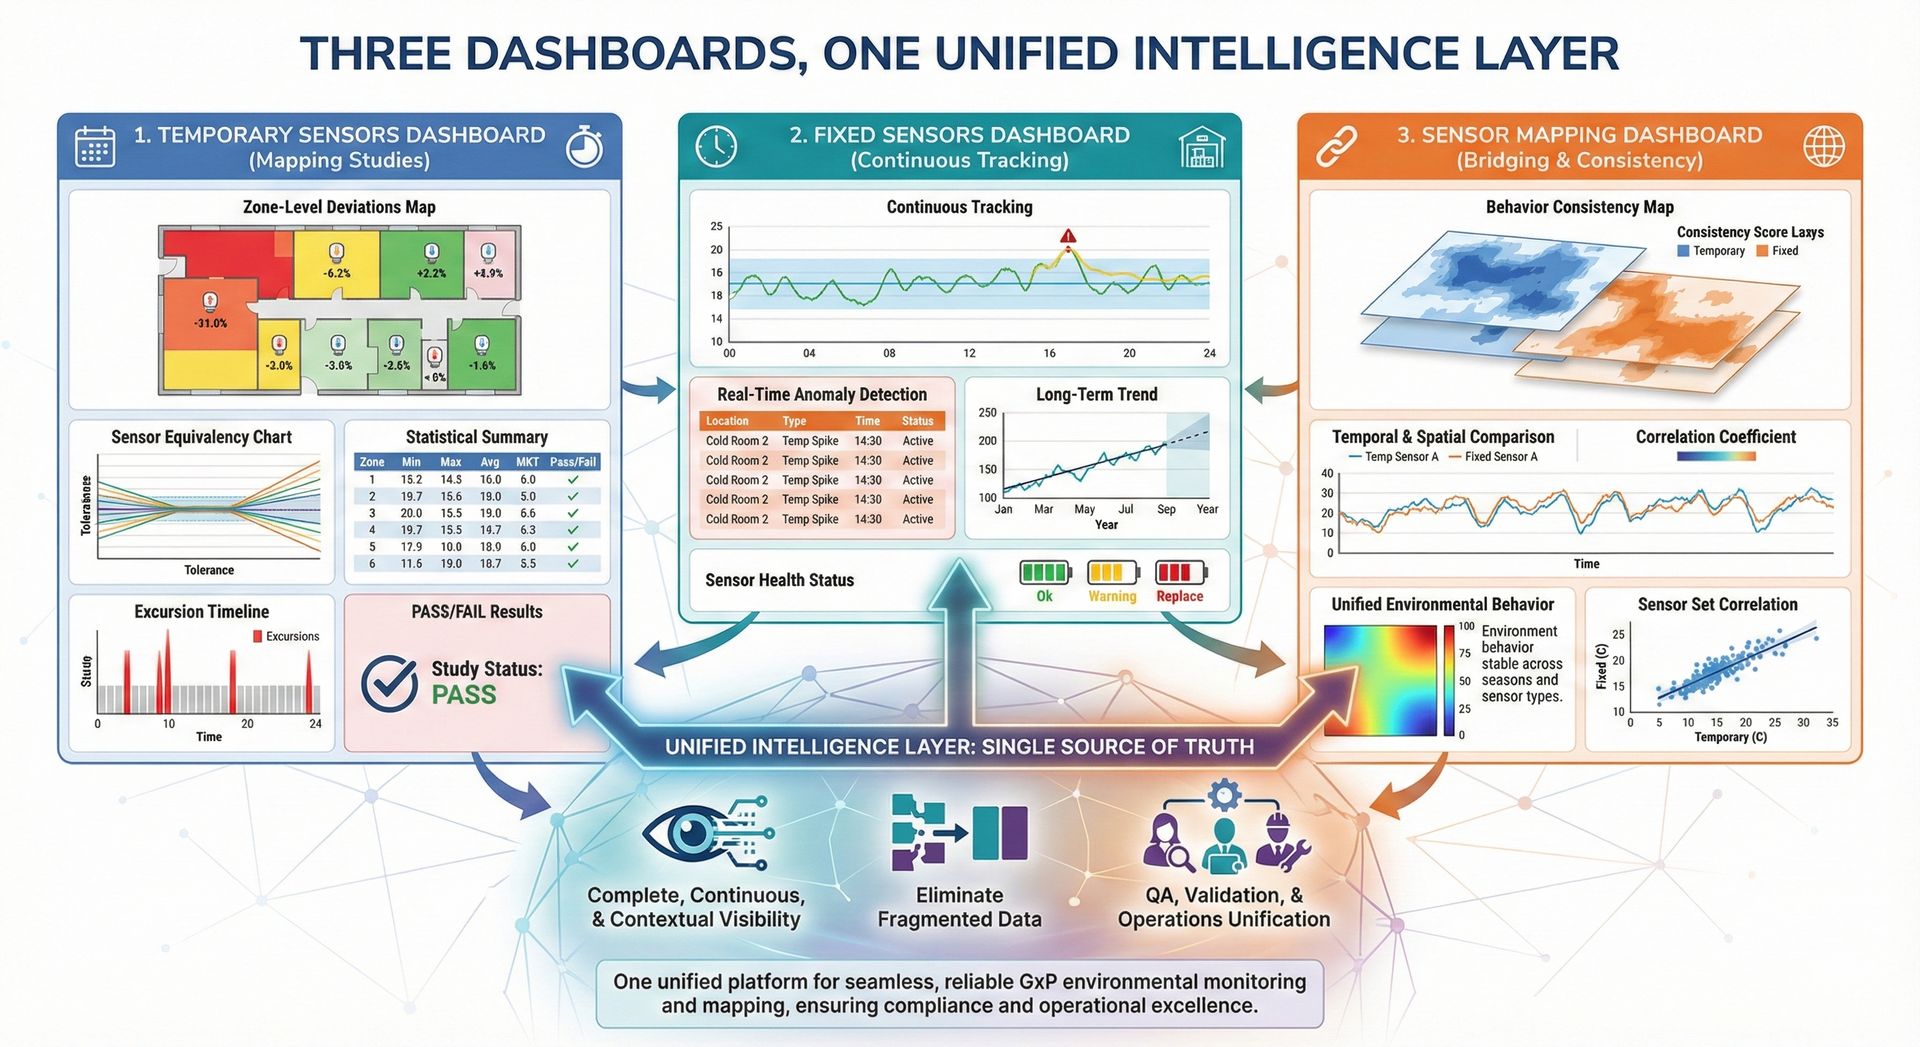
4.0. Three Dashboards, One Unified Intelligence Layer
Modern GxP environments require complete, continuous, and contextual visibility. cTM delivers this through three dashboards that unify all environmental data, providing QA, validation, and operations teams a single, reliable source of truth across temporary studies, fixed monitoring, and long-term environmental behavior.
1. Temporary Sensors Dashboard
Used in mapping studies, it shows zone-level deviations, sensor equivalency, statistical summaries, excursion timelines, and pass/fail results.
2. Fixed Sensors Dashboard
Ideal for warehouses, cold-rooms, and clean-rooms, it provides continuous tracking, anomaly detection, long-term trends, and sensor health.
3. Sensor Mapping Dashboard
Bridges temporary and fixed sensors, showing whether the environment behaves consistently over time and across sensor sets.
Together, they eliminate fragmented data and give QA, validation, and operations team a single source of environmental truth.
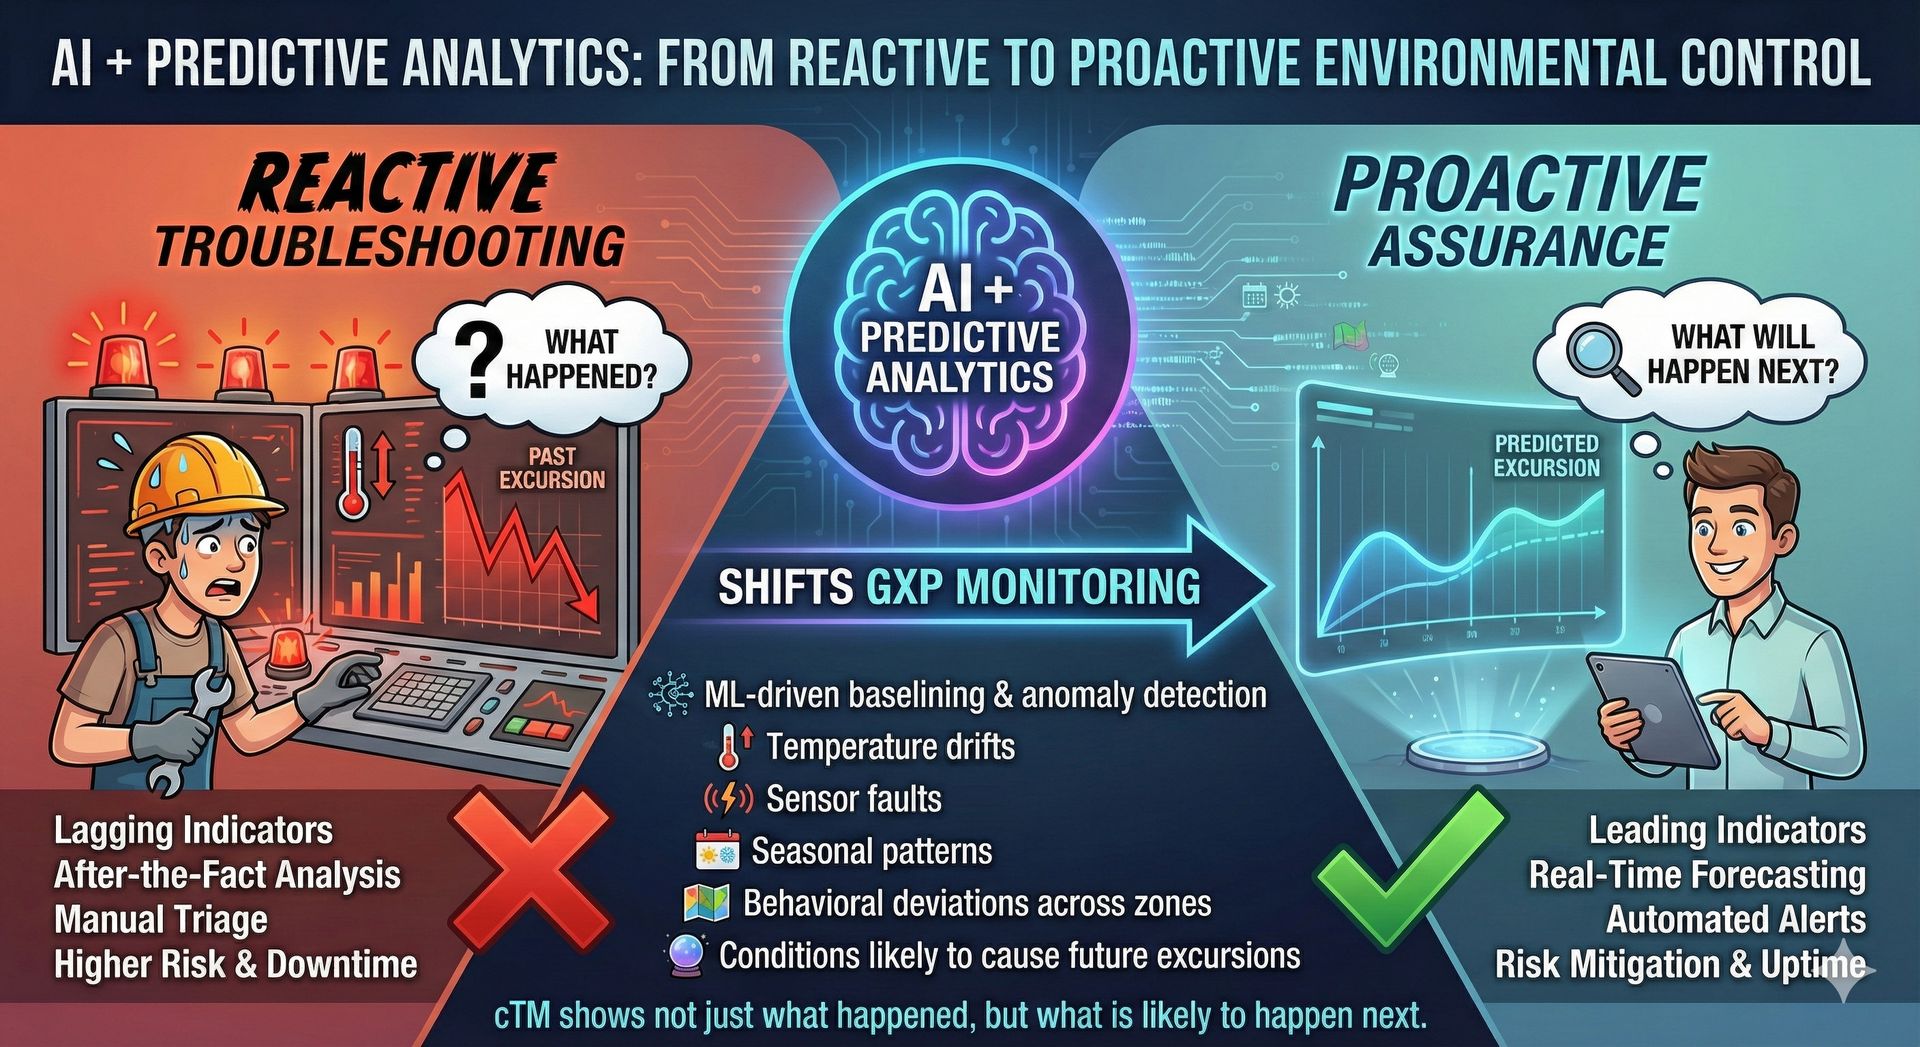
5.0. AI + Predictive Analytics: From Reactive to Proactive Environmental Control
cTM doesn’t just tell you what happened, it shows what is likely to happen next. With ML-driven baselining and anomaly detection, the system detects:
- Temperature drifts
- Sensor faults
- Seasonal patterns
- Behavioral deviations across zones
- Conditions likely to cause future excursions
This shifts GxP environmental monitoring from reactive troubleshooting to proactive assurance.
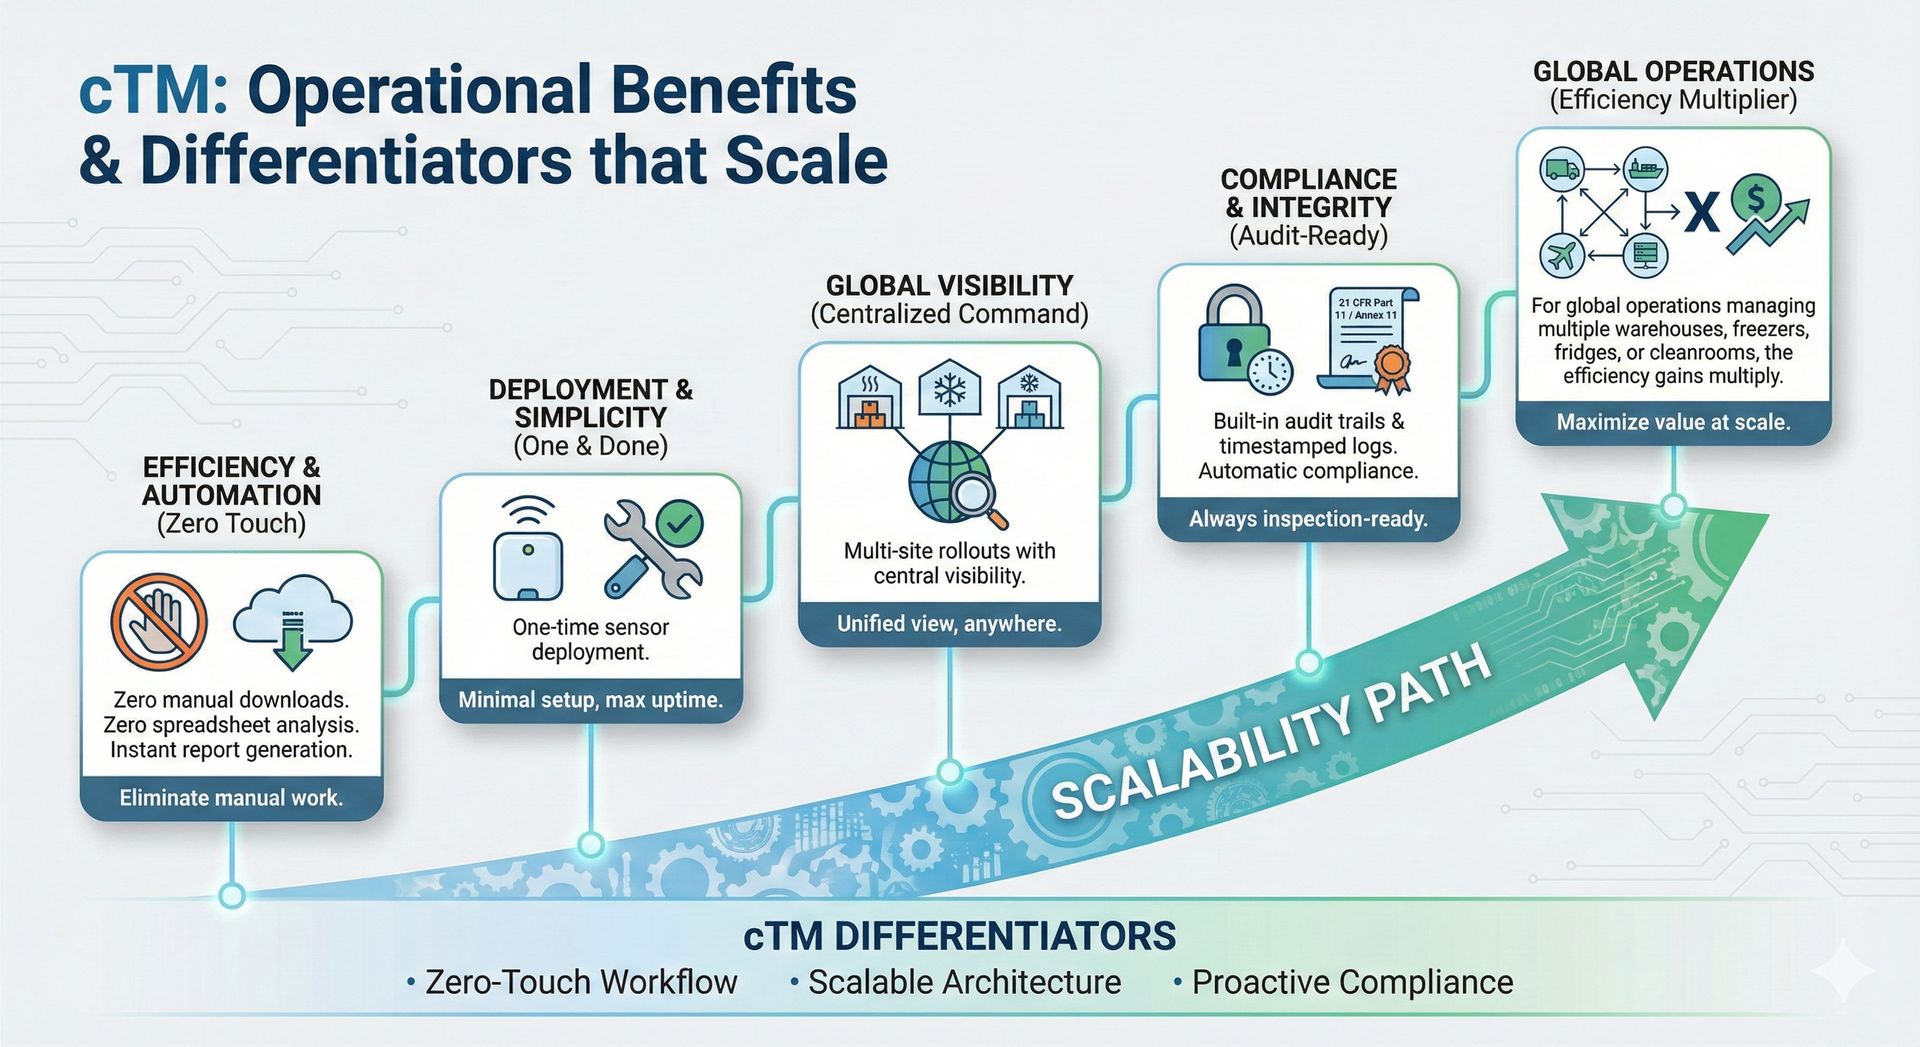
6.0. Operational Benefits that Scale with you
cTM delivers measurable value across the organization:
- Zero manual downloads
- Zero spreadsheet analysis
- Instant report generation
- One-time sensor deployment
- Multi-site rollouts with central visibility
- Built-in audit trails & timestamped logs
- Automatic compliance with 21 CFR Part 11 & Annex 11
For global operations managing multiple warehouses, freezers, fridges, or cleanrooms, the efficiency gains multiply.
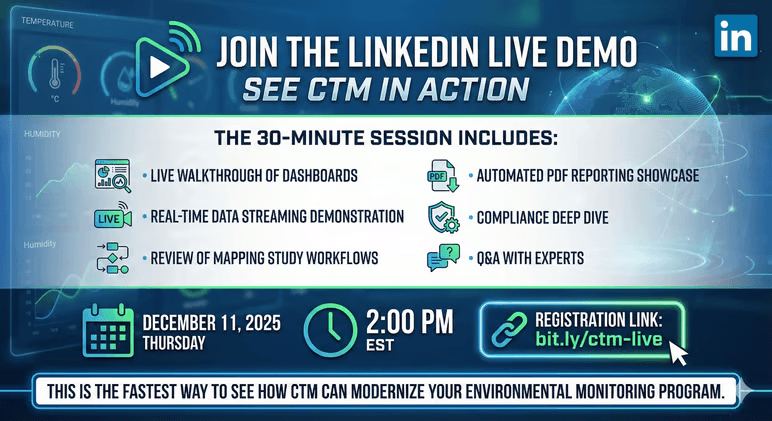
7.0. Join the LinkedIn Live Demo: See cTM in Action
The 30-minute session includes:
- Live walkthrough of dashboards
- Real-time data streaming demonstration
- Review of mapping study workflows
- Automated PDF reporting showcase
- Compliance deep dive
- Q&A with experts
📅 December 11, 2025🕒 2:00 PM EST
This is the fastest way to see how cTM can modernize your environmental monitoring program.
About the Author

About Nagesh Nama
Nagesh Nama is the Founder and CEO of xLM Continuous Intelligence and ValiMation, bringing nearly 30 years of experience in AI-driven GxP compliance, computer system validation, and regulatory technology for the life sciences industry. A recognized thought leader, he pioneered the industry's first Continuous Validation platform supporting compliant IaaS, PaaS, and SaaS environments under 21 CFR Part 11 and Annex 11. His work focuses on advancing intelligent validation, AI-powered compliance, predictive maintenance, temperature mapping, and GxP AI agents to help pharmaceutical, biotechnology, and medical device organizations accelerate digital transformation while maintaining continuous compliance. Nagesh is a member of the Forbes Technology Council and the Fast Company Executive Board, a contributor to Forbes and Fast Company, and has been featured by Microsoft for his work in AI agents.